
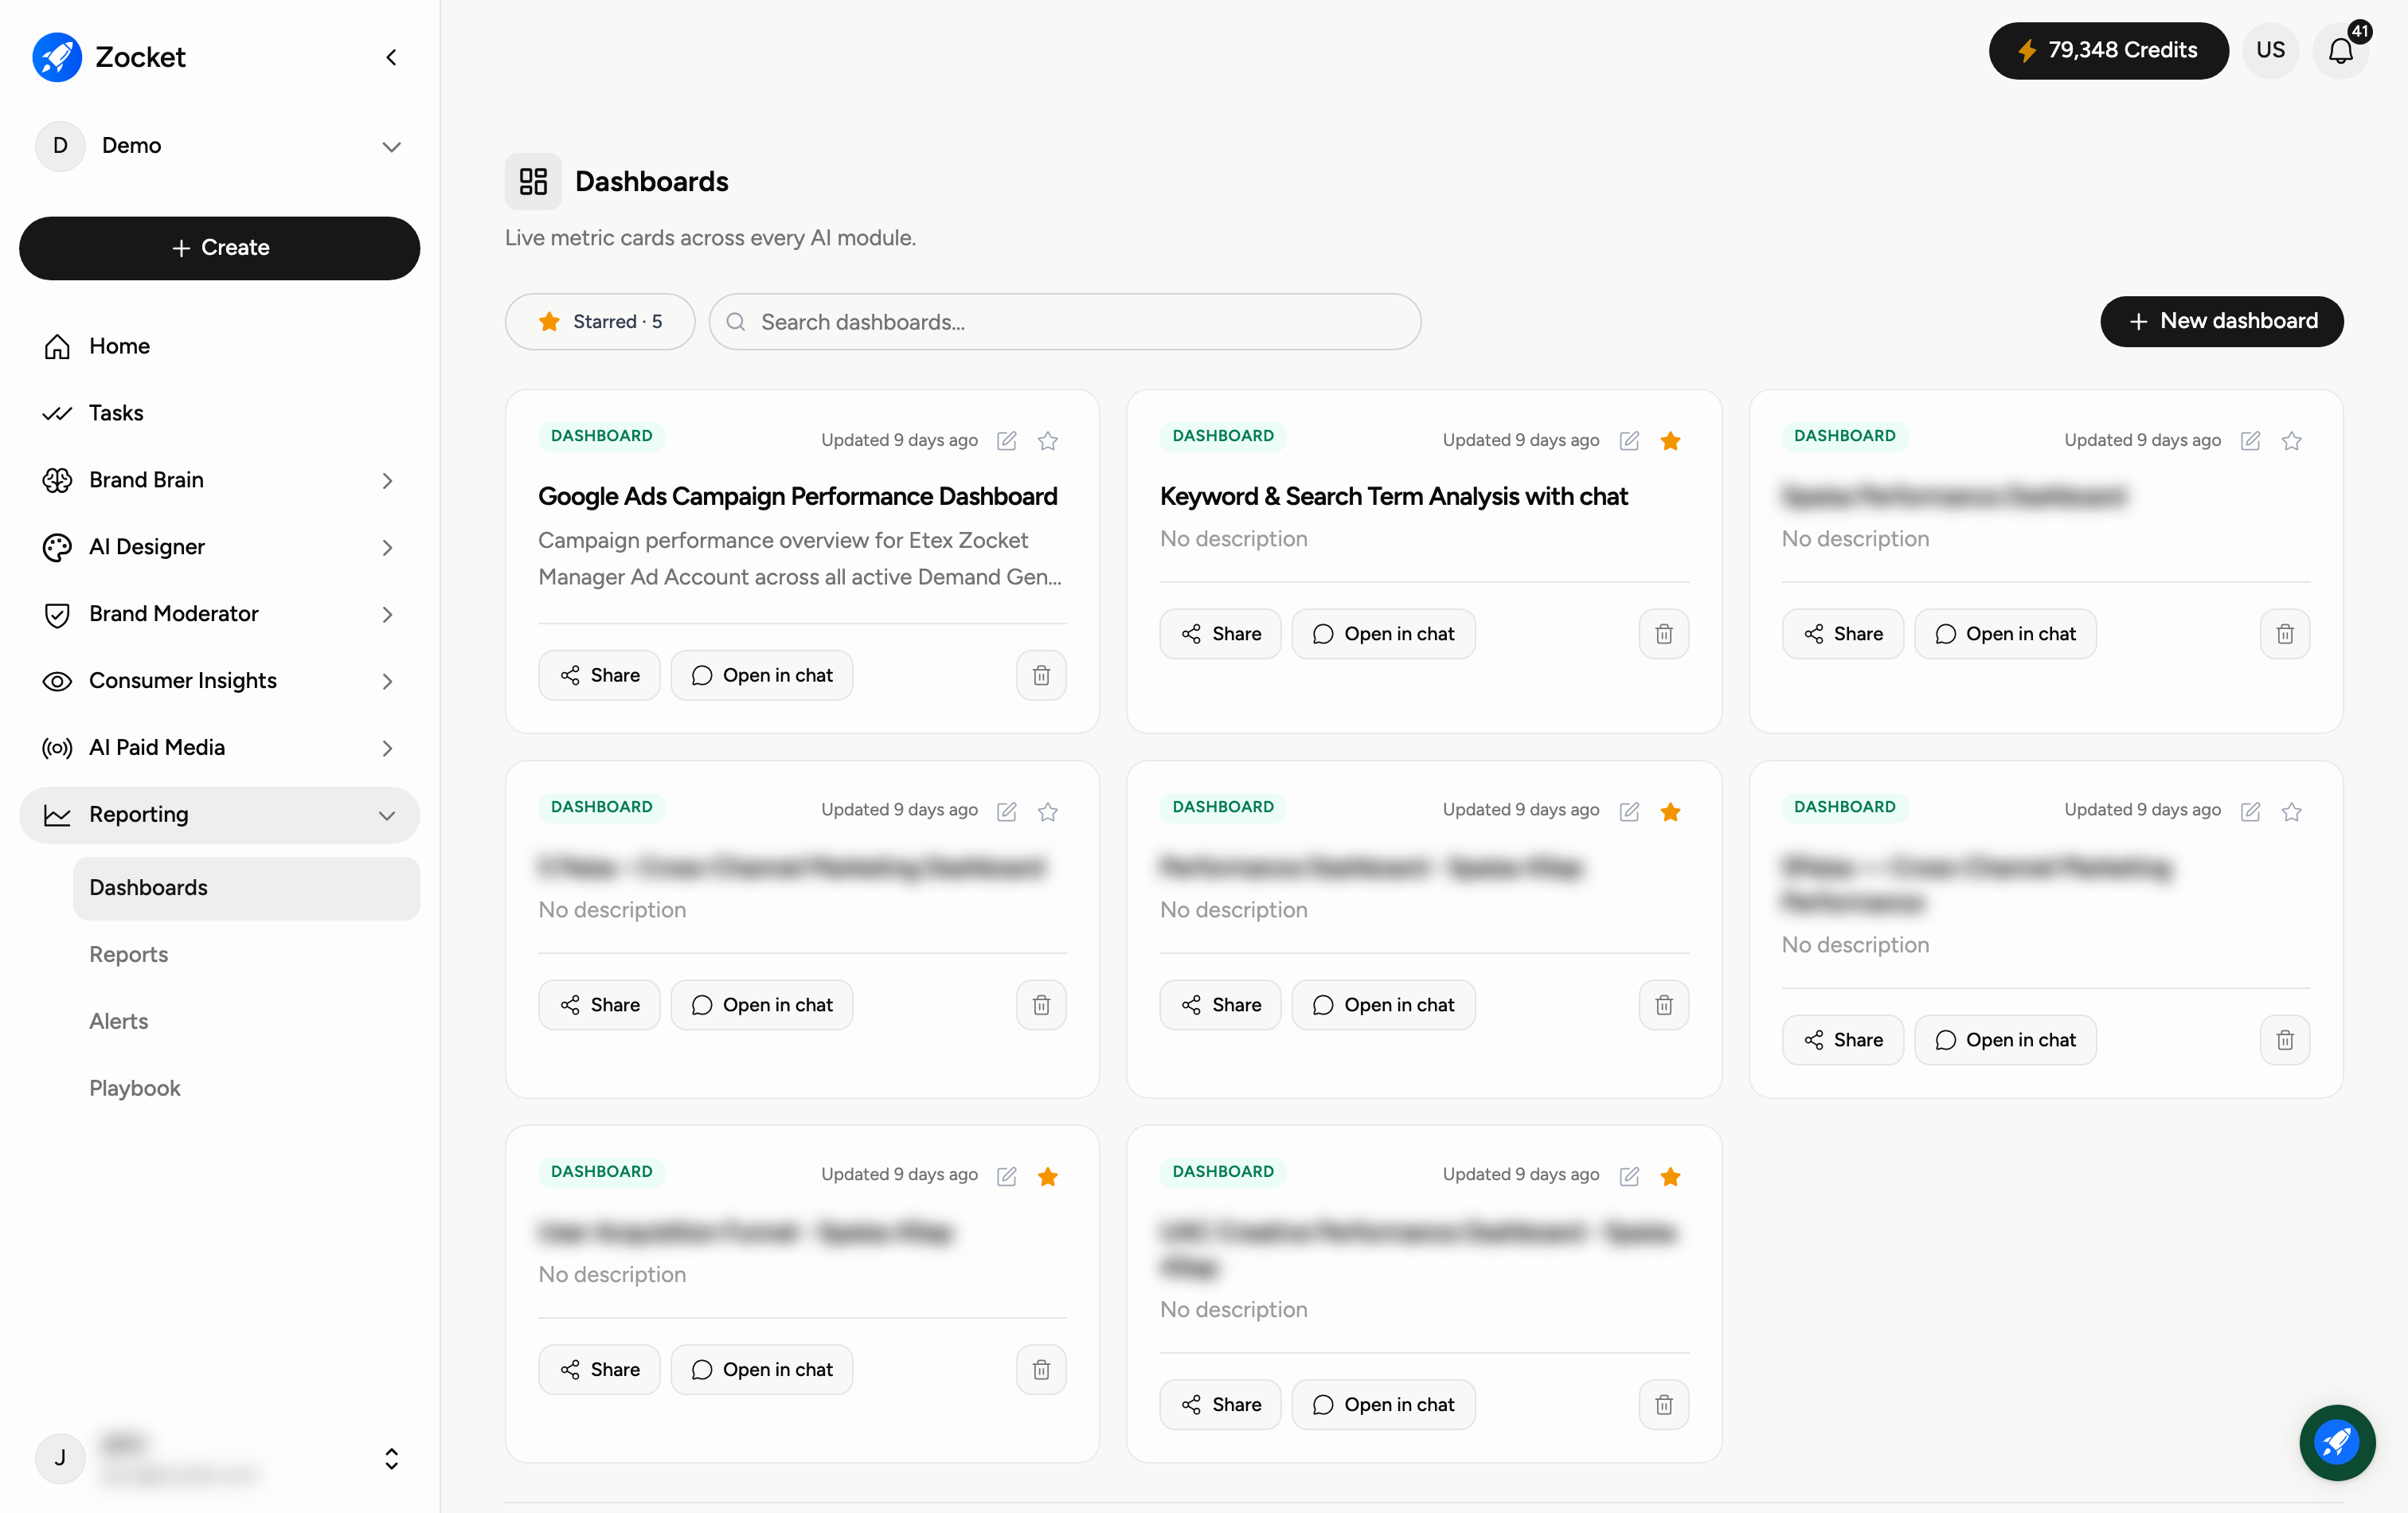
Dashboards are live, always-on metric boards that pull numbers from every AI module you use in Zocket — paid media, creative, brand moderation and more — into one screen. Unlike a static export, a dashboard you build here keeps refreshing on its own. You describe what you want in plain language and Zocket assembles the dashboard from your connected sources. Find them under Reporting → Dashboards.
Why you'd use it
Lets anyone build a live dashboard by describing it, then keep it. You don't configure widgets, you say what you want to see and the dashboard gets generated against your connected data. Because Reporting is now its own top-level section, these dashboards span every module, not only paid media.
Step 1 — Open the Dashboards page
In the left sidebar, click Reporting to expand the module, then click Dashboards. If you haven't built one yet, you'll see an empty state inviting you to create your first dashboard.
Step 2 — Start a new dashboard
Click + New dashboard in the top-right corner. A short dialog opens where you turn a plain-language brief into a live dashboard.
Step 3 — Name it and describe what it should contain
Give the dashboard a clear name (for example, "Meta CPL — Gold Loans"). Then, in "What should this dashboard contain?", describe the metrics in plain English — for example, "Live gold-loan CPL on Meta, refreshed hourly, with a trend line and an anomaly flag when it moves more than 15%." Zocket reads this brief and assembles the right metric cards from your connected sources.
Step 4 — Optionally add references
If you have a spec, a sample layout, or a source document, use Attach file or Add link under References so the AI has extra context for what to build.
Step 5 — Create and star it
Click + Create dashboard. Your dashboard is generated and stays current automatically. Use the Starred filter and the star icon to pin the dashboards you check most often to the top.
When to come here
Monday morning reviews. Standing stakeholder reporting. Any time someone asks for "a view of X" that would otherwise become a spreadsheet.
Frequently Asked Questions
Do I have to build charts manually?
No. You describe what you want in plain language and Zocket assembles the metric cards from your connected sources. There's no manual chart builder to configure.
Will the numbers update on their own?
Yes. Dashboards are live — they refresh on their own, so what you see is always current without re-running anything.
Which data can a dashboard show?
Live metric cards across every AI module connected to your workspace (paid media, creative, brand moderation and more), plus any sources you've connected under AI Paid Media → Connectors.
How is a dashboard different from a Report?
A dashboard is a live, always-on board you glance at. A report (Reporting → Reports) is an AI-generated performance write-up you can save, share, and attach a scheduled alert to.
Can I find a dashboard later?
Yes. Use the search box on the Dashboards page, or the Starred filter for the ones you've pinned.
Can I add references so it's built the way I want?
Yes — attach a file or add a link under References in the New dashboard dialog.
Can I share a dashboard with someone who has no account?
Yes. Open Share and turn on the public link — anyone with that link can view it, at the access level you pick beside it. Note that everyone in your organisation can already see it without a link; the Invite by email box on the same dialog is specifically for people outside your organisation.