
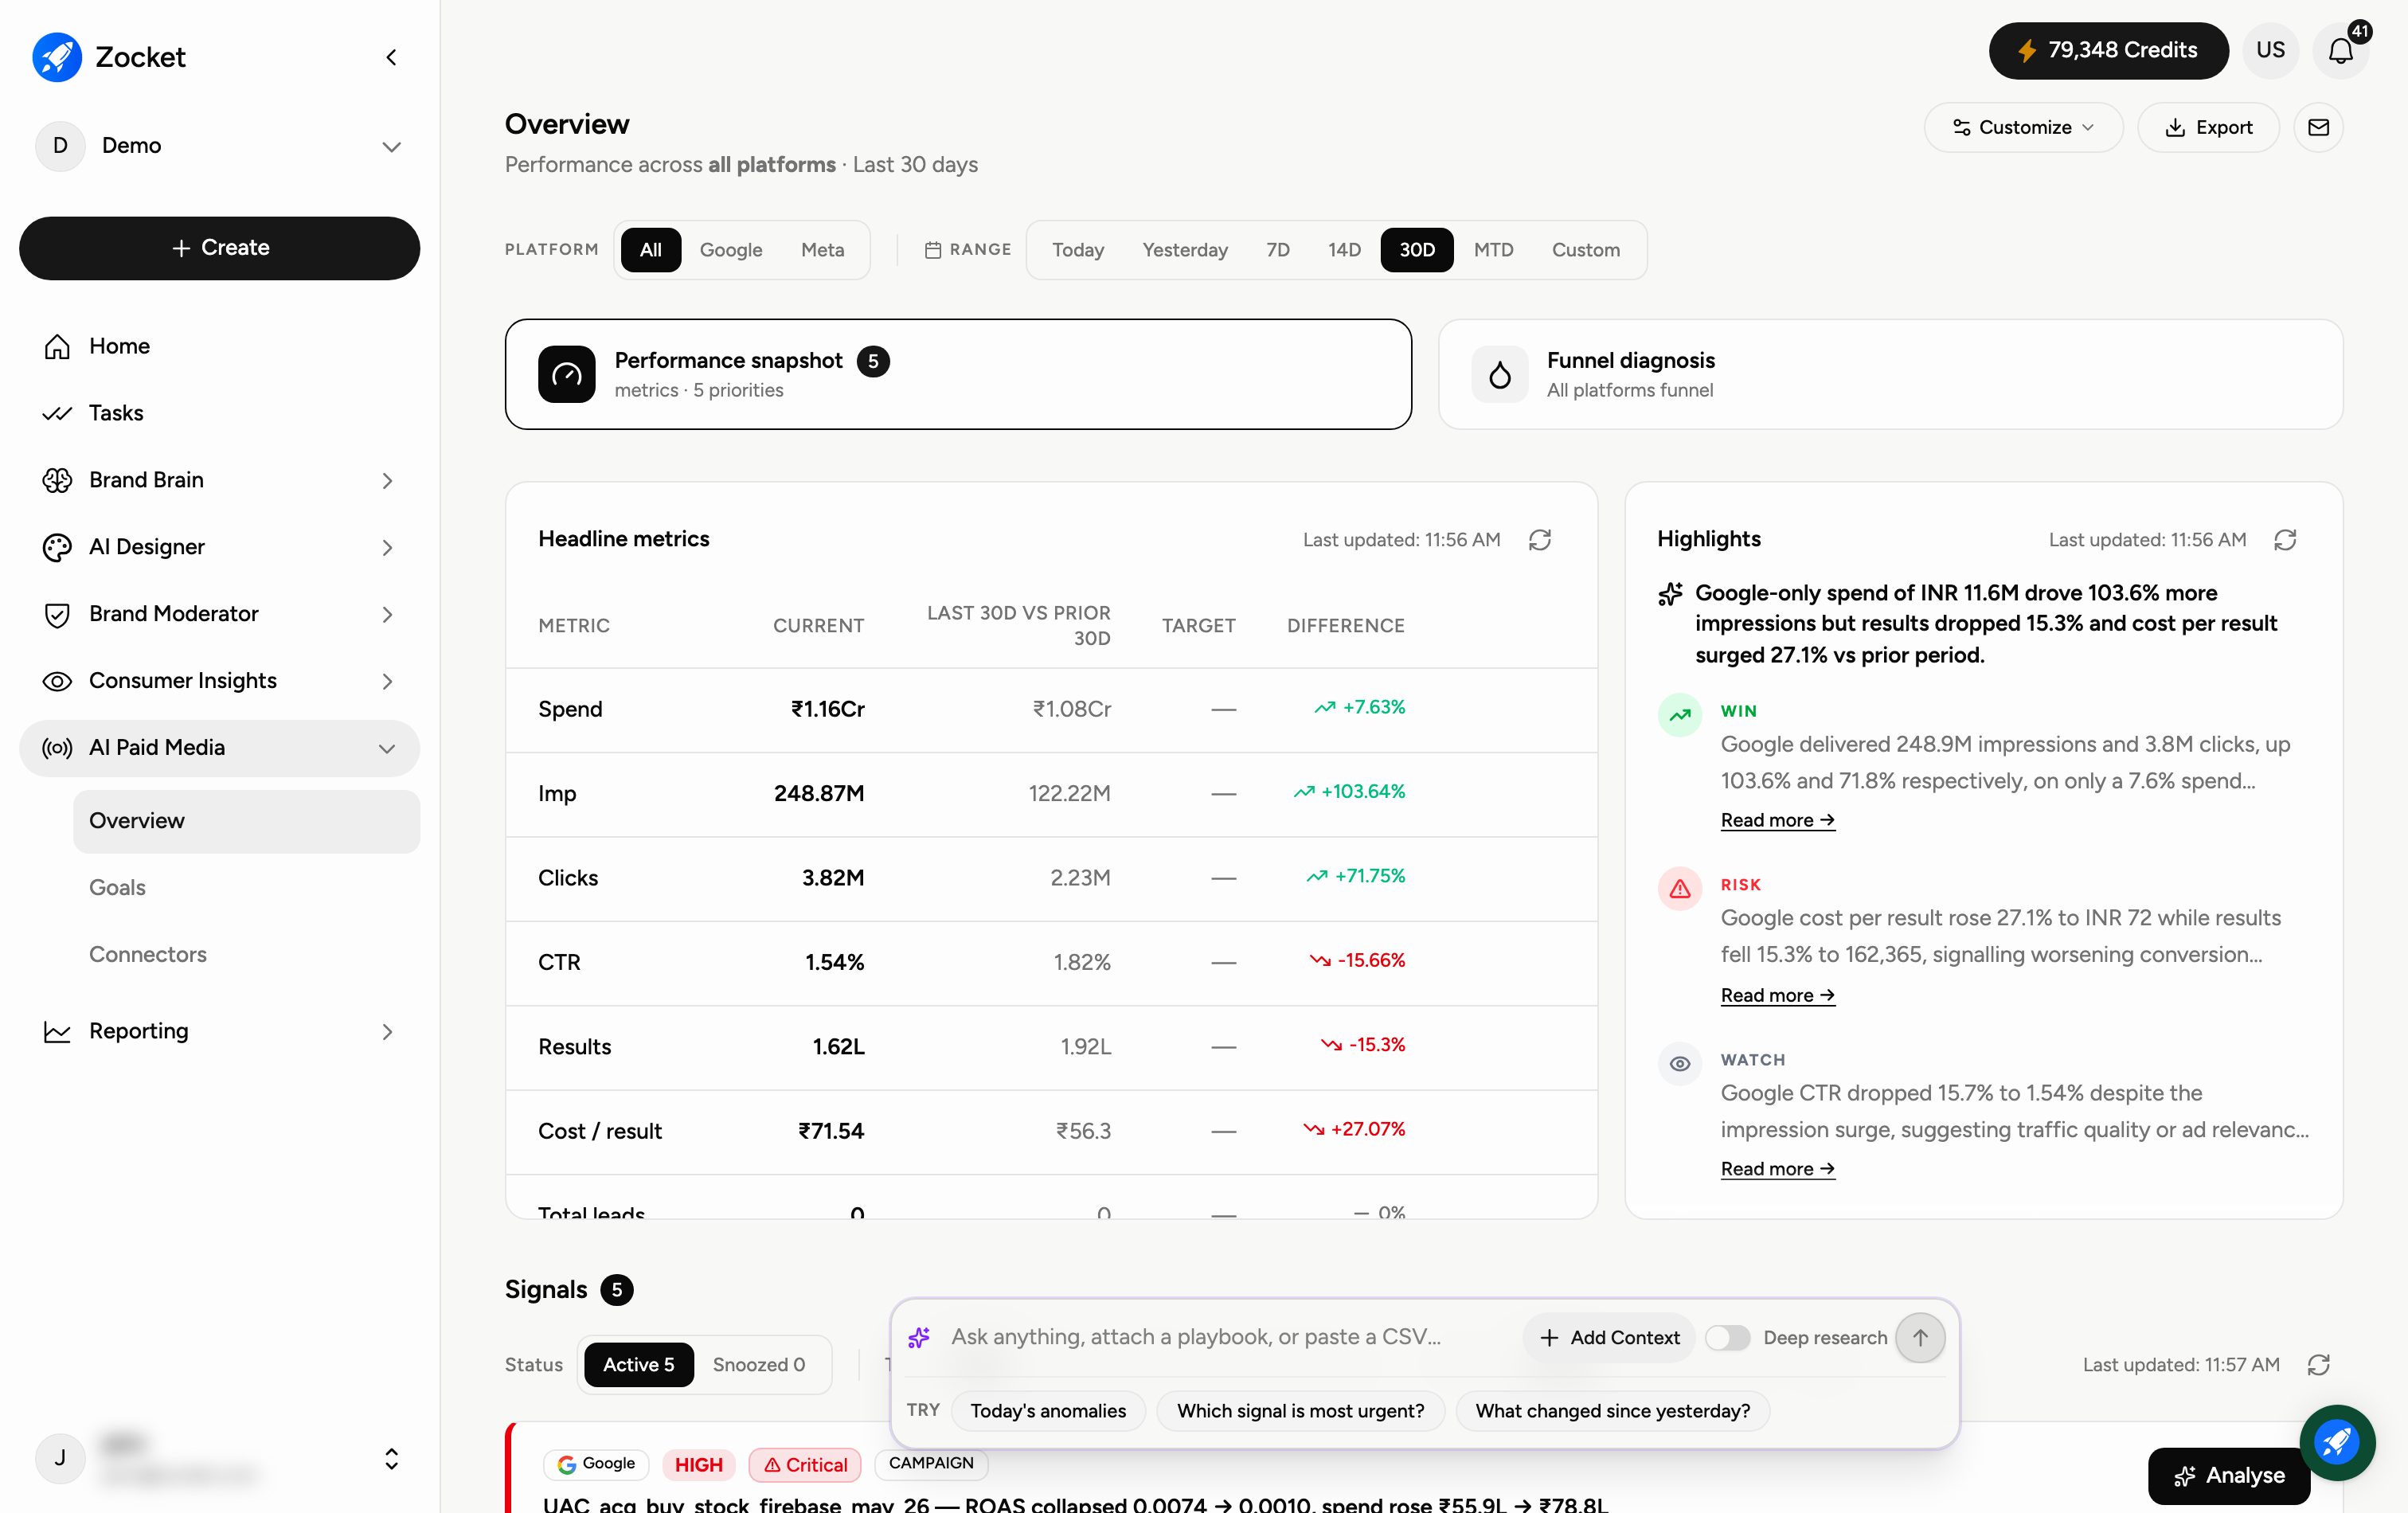
The Overview table is the first thing you see in AI Paid Media. Which metrics it shows, and over what period, are both yours to set.
Why you'd use it
Different teams watch different numbers. A performance manager wants cost per qualified lead; a brand lead wants impressions and reach. Rather than everyone reading a table built for someone else, you choose the columns that matter to you.
Step 1 — Choose your metrics
Click Customize above the table. You get a checklist of the metrics the module tracks:
Spend
Impressions
Clicks
CTR
Results
Cost per result
Total leads
Cost per lead
Qualified leads
Cost per qualified lead
Tick the ones you want on the headline table and untick the rest. At least one metric must stay visible.
A note on metrics outside this list. This is a visibility control, not a formula builder. If you need something the ad platforms do not report natively — add-to-cart rate, a blended CAC across channels, a margin-weighted ROAS — that is a custom build rather than something you switch on here. Talk to your Zocket contact; it is a common request and it is doable, but it is not self-serve.
Step 2 — Set the period
The period selector offers Today, Yesterday, 7D, 14D, 30D, MTD and Custom for an exact date range.
Step 3 — Read the comparison
You do not have to build a comparison. Whatever period you pick, the table also shows the same window immediately before it and the difference between them — so a 30-day view is automatically 30 days against the previous 30.
Read the difference column before the absolute number. Spend of ₹11 lakh means little on its own; spend up 23% while cost per result rose 15% is a finding.
Good to know
Filter to All, Google or Meta to see one platform's numbers against the same period.
Export takes the table as it is currently configured, so set your metrics and period before exporting.